Archive 19/01/2023.

Program always fully utilizing one core

Lys0gen

Hey,
I have noticed that my application always uses ~25-26% of my quad core CPU even with basically nothing going on.

My application is VSync capped to 60 FPS and thus I don’t really know why it uses so much. Same thing with the most basic samples (though I’m not sure if the FPS is actually capped there).

Anyone knows if it’s possible to avoid this?

Eugene

What part of the code consumes the CPU then?
Are you sure it’s the engine code and not GPU driver during VSync?

Pencheff

VSync basically blocks program execution until the monitor is ready to take your next GPU frame. That is the case in DX9, that is also why most PC “pro” gamers tend to avoid it, it adds latency to your input, which usually works in the same thread as the renderer. I’m not sure about DX11, I think it works similar, that is, the GPU driver waits your monitor scanline to go to the last line in the bottom and then consumes the frame you pass. You can easily check that if you turn on the Urho3D profiler, most time spent will be in Present.

You can fix that if you set engine FPS limit to 60 (or your monitor refresh rate), it will call ApplyFramerateLimit() on every frame, which will relax your CPU. I do that in my app with DX9, GL3 on linux and GLES on ARM devices.

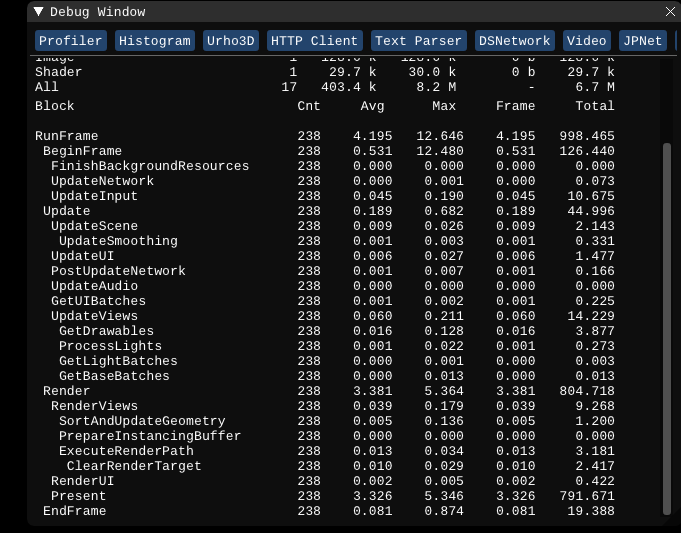
No framerate limit:

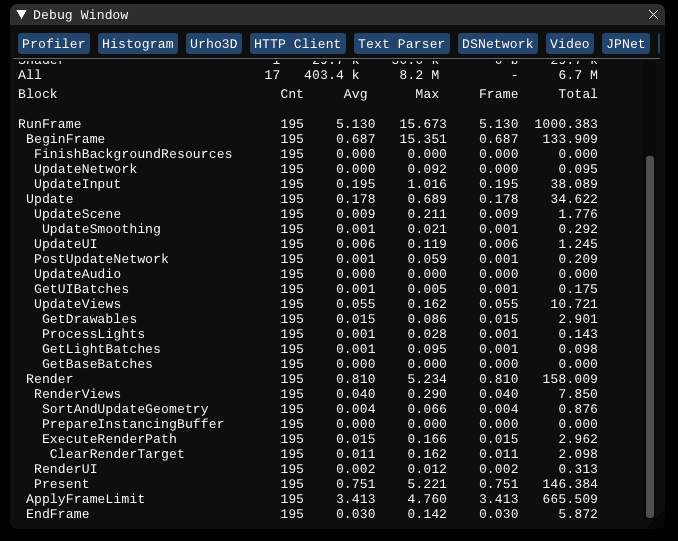
Framerate limit:

Notice Total time spent in Present when no framerate limit is applied is almost 800ms, that is 80% of the CPU time.

Lys0gen

Not sure what consumes the CPU. Until now I didn’t realize Urho had an inbuilt profiler - will try to check that out. But I’m pretty sure it is engine related, as I don’t have this issue with other games (if they’re FPS capped).

How are you doing that? I’ve tried it two ways, both alone and together:

  • Setting the engineParameters in ::Setup
    engineParameters_[EP_VSYNC] = true;
    engineParameters_[EP_REFRESH_RATE] = 60;
  • Setting the refreshRate and vsync parameters of my Urho3D::Graphics::Window -> SetMode(…)

Sadly neither does anything to relieve the CPU… That said, even if I don’t set these values my shoddy FPS counter (which basically just counts up in the function registered to the E_UPDATE event) shows 60 FPS. Maybe the engine handles the “main loop” different than I expect it to.

Will try to plug the profiler into my code later, maybe that will be a bit more revealing. (All this is on Win7 with OpenGL btw)

Pencheff

You just have to do

GetSubsystem<Urho3D::Engine>()->SetMaxFps(60);
Lys0gen

Thank you! That helped, although it still uses ~13% CPU for just displaying less than 10 simple UI elements, much more than I would’ve expected. But whatever, good enough for me right now :slight_smile:

Pencheff

You should turn on the debug renderer and print the profiler info to see whats taking that much time. Also, 13% CPU time doesn’t necessarily mean that it is a heavy app, it will not scale to 26% with 20 UI items, but probably remain 13%. Its just how VSync works, it spin waits in a loop until scanline is ready. There are some techniques I’ve used in the past to overcome this issue, but I ended up just limiting the frame rate below the monitor refresh rate.

Also, windowed mode VSync is always a bit heavier than in fullscreen (DX9 especially), so maybe try to render in fullscreen exclusive.