Archive 19/01/2023.

Profiler rework and profiling tool

rku

As it turns out Urho3D has very VERY basic profiler which is of limited use. Since i have unexplainable performance issues with my attempt at android game i decided to take up the task.

You can check out the code on github . Use as you wish but do not fork . I will overwrite/ rebase -i those commits there to maintain perfect git history.

Main highlights:

  • Reworked bunch of code to avoid as much dynamic memory allocation as possible. Doing that on every interval is costly. Now logging every frame is realistic.
  • Cleaned up profiling code from seemingly unrelated places (Timer/Context).
  • Added ability to save profiling data to file.
  • Added setting to gather statistics only on N intervals. Now profiler can run indefinitely and once you reproduce the issue you can save profiling data of certain timeframe for inspection.
  • Added Qt5-based profiling data viewer tool.
  • Added system for supplying multiple data sinks to profiler for data consumption. DebugHud was reworked to use that system.

I am not done yet though. Ultimate plan is to create network data sink for profiler so we can stream profiling data live from running application to the tool. This should simplify profiling of mobile devices a lot.

If these changes are acceptable i would love merging them upstream. If you have any ideas - i would love to hear them.
Eugene

I definetly want it.

codingmonkey

I’m not using so often profilers
Just curious such detalization profiler like this https://github.com/bombomby/brofiler
Is it available to add into Urho3D ?
also what profits or trade-off vs default VS Profiler ?

TheSHEEEP

Not having to use VS would be one of the most obvious profits to me :wink:
Both for people working on other platforms and for those simply not liking VS.

Bonus +1 for Qt.

rku

@codingmonkey i wanted to use off-the-shelf parts as much as possible because well… lazy. Thing is there does not seem to be appropriate tools out there. Never seen Brofiler before, but it is of limited use to us as its windows-only. Current profiler appears to gather all the information Brolifier does minus non-main threads. Brolifier does present it in a nicer way though, no denying that.

As for other profilers - i can not comment on VS, but linux perf tool appears to capture stack traces at user defined frequency. What we end up is a rough estimation on code paths that were seen most times. I am not entirely confident this is enough to troubleshoot very elusive performance problems like i am experiencing. Those micro lag spikes would just get burried in a flamegraph .

rku

Just added sending profiling data over network. This is still unoptimized as it sends all hash strings over network with each interval, but a good start nonetheless. Works great on local machine. All you have to do is:

_profilerSink = new ProfilerNetworkSink(context_);
_profilerSink->Connect();
_profilerSink->SetReconnectDelay(3);
GetSubsystem<Profiler>()->AddSink(_profilerSink);

Fire up profiler tool and watch the data flow in.

Edit: this might be worth looking into though: https://github.com/yse/easy_profiler

Edit:
This stuff is goooood

Edit:
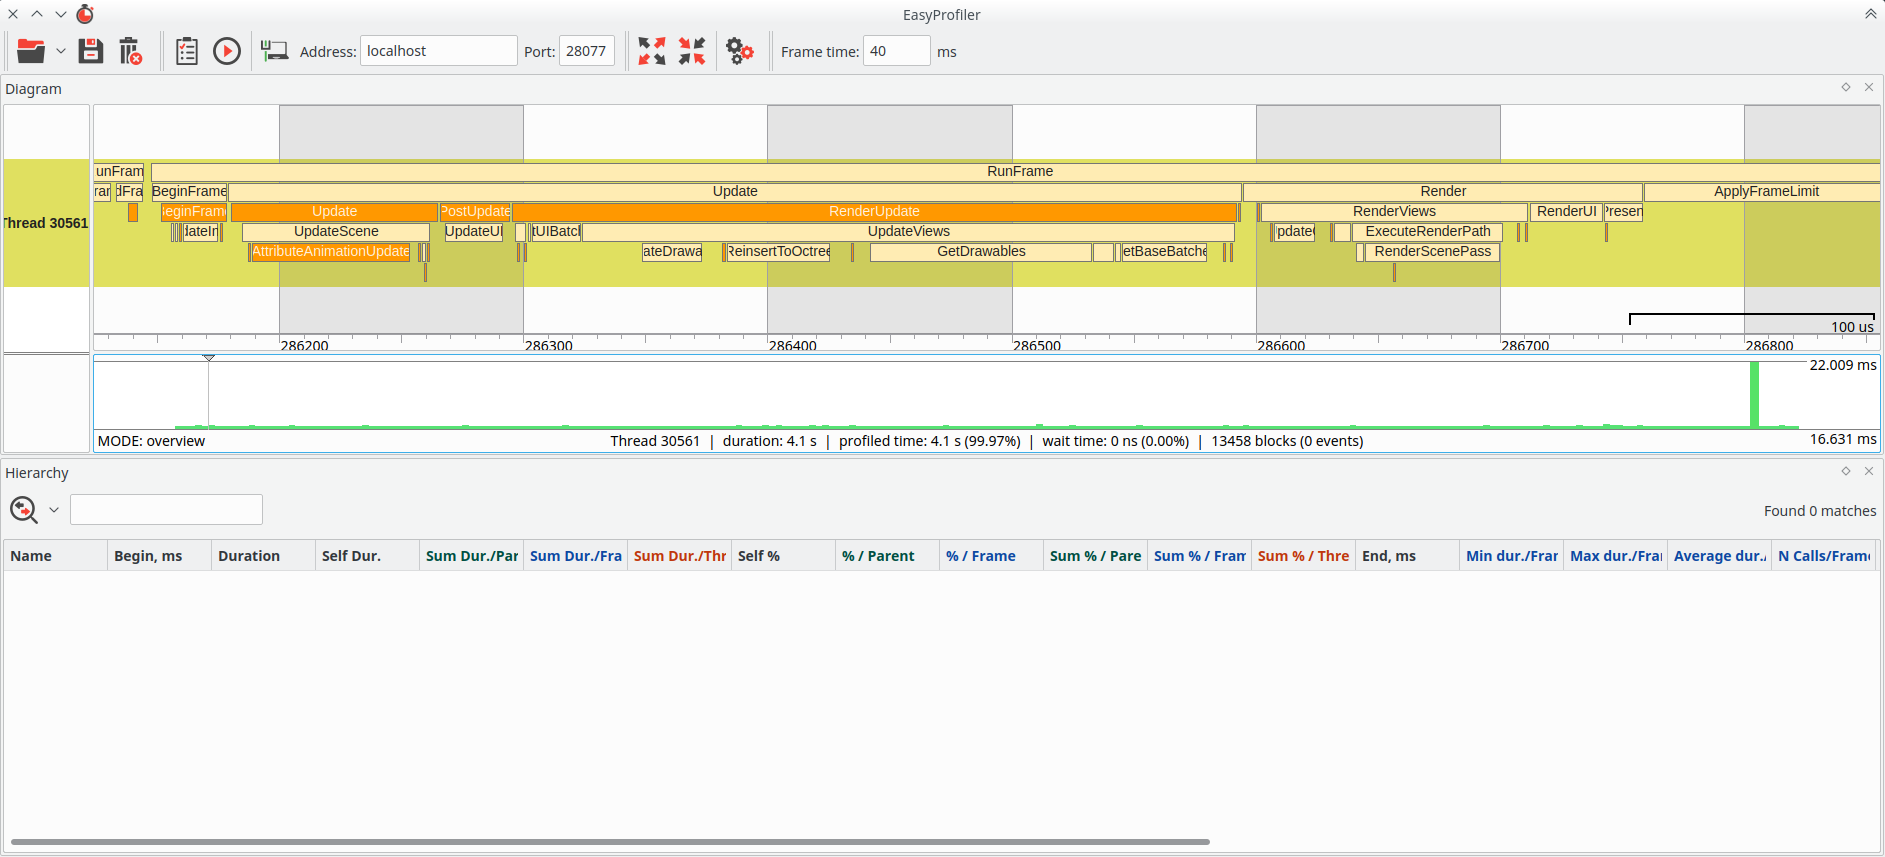
A better screenshot:
I am going to polish integration of this lib instead because honestly - no point in reinventing the wheel when we have a rocket engine here. I do not think i can build a rocket engine, i just want to get my work done / goals reached really.

As you can see it supports logging performance on all threads as well. Different colors represent different kinds of logged code paths. Orange items are events, blue would be resource loading, yellowish are normal code blocks. We can specify our own colors as well. It already supports sending data over network. I am not sure i can get profiler tree to be printed on debug hud though. Would it be ok to sacrifice that?

yse

Hello.
I’m a maintainer of easy_profiler. I’m glad to see it useful for you.
Because the documentation is small at the moment we can help you. Ask question about core and gui and we will answer to the best of our opportunity.

rku

Thank you for kind offer, if i bump into any problems - i definitely will. So far it seems i have things figured out. I noticed there are windows-specific build options EASY_OPTION_EVENT_TRACING and EASY_OPTION_LOW_PRIORITY_EVENT_TRACING . What do they do exactly?

Edit:
Is there any way to access logged events from within application? I cant find anything like it. Closest thing would be dumpBlocksToStream() function but its internal. Reason for this would be displaying currently frame info on screen in game.

victorzs

Hello!

EASY_OPTION_EVENT_TRACING turns on/off event tracing for Windows to be able to capture thread context switch events. As Windows event tracing requires creation of separate thread for events handling, you may wish to disable it at all - that’s for this option is used.

EASY_OPTION_LOW_PRIORITY_EVENT_TRACING sets priority for event tracing thread to Low to reduce it’s impact on the application performance, but in that case you can miss some context switch events as profiling session could be stopped before all these events are gathered.

By the way enabling/disabling event tracing and changing it’s priority can be done via profiler_gui after connecting to the profiled application. So using the above options affects only default state of the profiler.

As for the last question, there is no such possibility yet, but we are opened for ideas. Which information would you like to access during profiling? Maybe it would be better to display frames in profiler_gui at runtime instead of displaying them in the profiling application?

victorzs

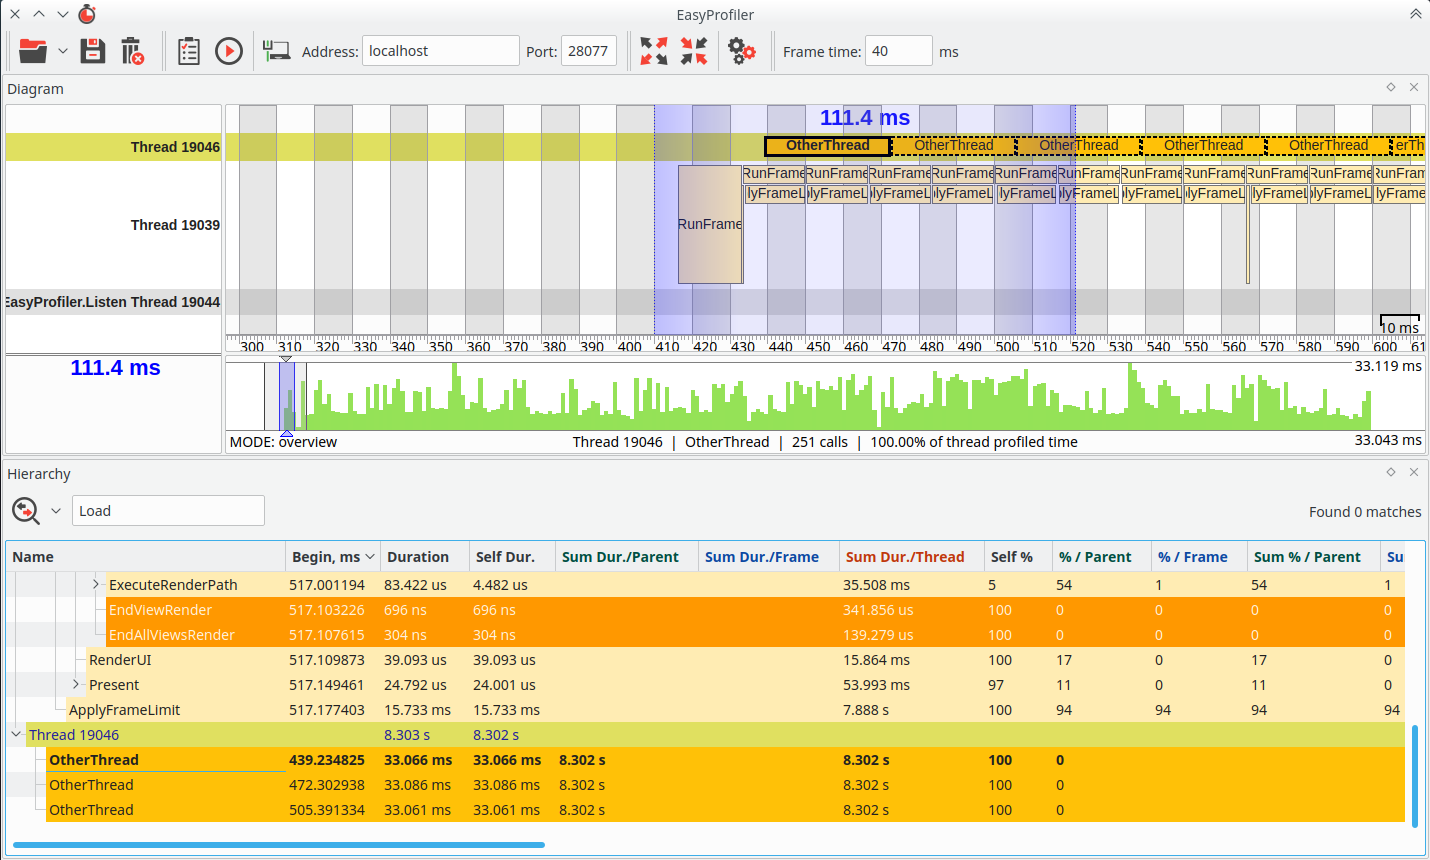
If you try to change the value of the “Frame time” at the tool-bar you would see different colors at the histogram where all frames are displayed (green columns on a screenshot below main blocks diagram). Red color indicates frames which were executed longer than expected.

If you set “Frame time” to 0 then histogram would be colored in next way: from green color (minimum duration) to red (maximum duration).

Also this histogram has two modes: overview mode (by default) - when all captured frames are displayed, and zoom mode - when histogram displays only frames which are currently visible on a blocks diagram. Click right mouse button on the histogram to change mode.

rku

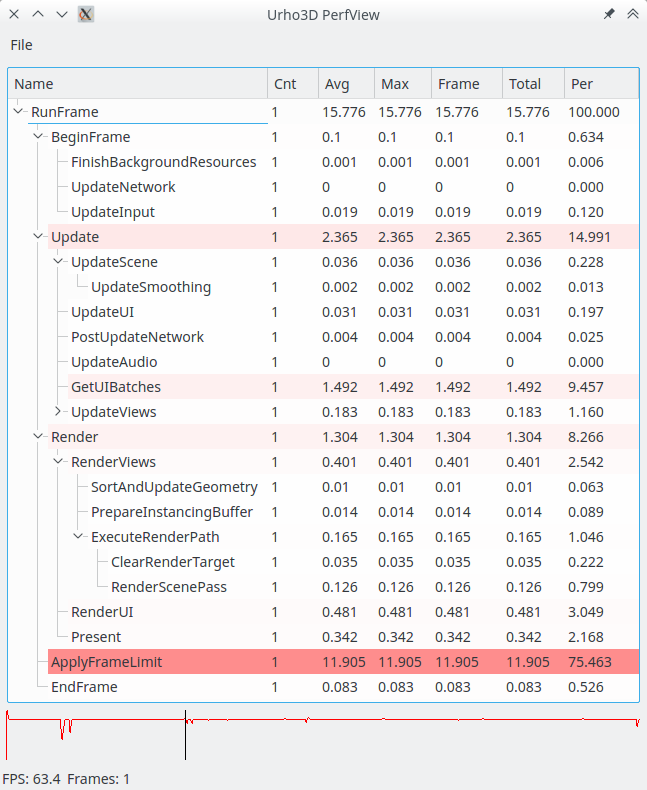
Currently Urho3D debug hud may display a tree of executed events and how long they took. That information is gathered in intervals and averaged out. Getting access to frame event trees of last T seconds would be sufficient. I definitely agree that viewing this information in profiler_gui live would be better, however if i were to try and get this merged maintainers might require to preserve old functionality as well. Besides displaying that simple tree on screen could also be useful for spotting quick and dirty slowdowns thus speeding up iteration cycles.

victorzs

Getting a tree of events could be very difficult and expensive operation because all events for each thread are stored in one-dimensional (and one-directional) buffer without saving a hierarchy (hierarchy restored by reader and this is a quite expensive operation as you can see when opening a file). This is done to reduce memory and timing cost for store operation as much as possible for profiled application. I’m missing a point why you need to get full tree of events at run-time? Full tree could contain thousands or tens of thousands of events.
What can be simple: additionally store duration for top-level events (frames) in a separate container (this is not free of charge though) or store only last frame duration in atomic variable (this should not cost anything) - you could still draw a diagram like on this screenshot: https://global.discourse-cdn.com/standard17/uploads/urho3d/original/1X/221c99ba40e3ad5a03ddf9add16ee494100bf395.png
By the way, do you need to get durations for all threads or for one main thread only?

P.S. I think it would be better to continue this conversation in private (if it is possible here) as it has a lot of technical details related to easy_profiler and not to Urho3d

rku

Current profiler shows just current interval (slowest time and averages of event times in certain timespan, say 1 second) information of main thread events. I am just aiming to support current behavior of urho3d with new profiler, thats why i am asking for this.

To be honest - i am not sure this is even needed. Lets make sure. @cadaver / @weitjong - is there a chance PR integrating easy_profiler would be accepted? It has great tool for inspecting data but does not currently easily expose data at runtime so debug hud would loose display of performance data. Is that acceptable?

@victorzs if maintainers decide this is PR-worthy but we still need to maintain display of said info at runtime i will make an issue on github so we can discuss possible options. I hope they give an OK to loosing performance data display at runtime as it is not of much practical use anyway.

victorzs

Well, as I said getting a duration of frame would be easy. I have just been confused by “displaying a tree of events”. The profiler requires an additional regime though in which it measures only frame times and do not store any events until enabled.

victorzs

@rku , there are some changes to profiler: you can now get slowest frame duration (local max since the moment of last query) and previous frame duration in cpu ticks or microseconds.
Use profiler::this_thread::frameTimeLocalMax() for getting frame time for current thread or profiler::main_thread::frameTimeLocalMax() for getting frame time for main thread (main thread have to be marked by using EASY_MAIN_THREAD macro to get profiler::main_thread functions work).
Just reminding that “frame” means every top-level block (block without parents).

You can find these changes in develop-HEAD at github repository. We would be thankful for getting a feedback before adding this feature into release version. Any suggestions are welcome.

P.S.: Another big update is that we have changed GPLv3 license to MIT. Now EasyProfiler could be licensed under either of MIT or Apache v2.0 at your option (as always, you do not need to put both LICENSE files with sources/binaries - you need to put only one license file you like). We are still using double licensing due to compatibility with larger variety of projects.

victorzs

New release v1.1.0 available.
Whats new in a few words:

  • GPLv3 license changed to MIT .
  • Added API functions to get maximum and average duration of frame (for getting information for current thread use profiler::this_thread:: ; for getting information for main thread use profiler::main_thread:: ). Maximum and average duration are calculated always (even if profiler is disabled). You should mark main thread with EASY_MAIN_THREAD .
  • Added live FPS Monitor to GUI. You just need to connect to the profiled application and fps monitor will start to receive max/avg frame duration of main thread. You should mark main thread with EASY_MAIN_THREAD in the profiled application. There are several settings for FPS Monitor available (See Settings -> FPS Monitor ). If you do not want GUI to send network requests to the profiled application then just hide FPS Monitor ([x] button or right click -> Hide).

Edit 26.04.2017:
Ugh, the forum says that I have reached the reply limit so I have to edit previous post :frowning:

@TheComet , @sabotage3d Yes, it could have issues if the same thread would be executed at different cpu cores.
We have used rtdsc for *nix platforms because it was the only fast solution:
with clock_gettime we have got ~800ns per block
with std:: chrono - ~600ns per block (msvc2013 and gcc4)
with rtdsc - ~15ns per block
with QueryPerformanceCounter - ~15ns per block

In our project we have millions of blocks per several seconds profiling session - that’s because we have chosen the last two timers.

We know that std::chrono has been fixed in msvc2015, but we have not tested yet. Also we have not tested std::chrono for gcc5.

I think we would add an option to CMakeLists for choosing the timer in release v1.2.0

TheComet

https://msdn.microsoft.com/en-us/library/windows/desktop/ee417693(v=vs.85).aspx

I looked at your timing code and I think it is an incorrect decision to make use of the rdtsc instruction. As explained in the link above, it has many issues.

I see you already use QueryPerformanceCounter for Windows. On linux and mac I suggest using clock_gettime() with CLOCK_PROCESS_CPUTIME_ID

sabotage3d

If it is C++11 shouldn’t we use std::chrono on every platform?

yushli1

This branch ( https://github.com/rokups/Urho3D/commits/feature/Profiler-rework ) no longer exists. Are you still working on it? Do you have plans to merge it into Urho3D’s main branch? I think that will be a great tool to have when using the engine.

rku

Since maintainers of Urho3D were not interested in having this, i contributed easy_profiler support to AtomicGameEngine .

yushli1

I think that is a great tool to have. Do you like to reopen it so that I can pull it over?

rku

If you wish to make use of that profiler you should take code straight from Atomic. Porting it would be very easy. Take a look at my PR to get idea what changes were needed to be done. Be aware that since PR code received some tweaks and fixes. In short: i replaced Profiler.h and Profiler.cpp , tweaked Object::SendEvent() , added easy_profiler third party dependency and added few other minor changes here and there.

yushli1

Thanks for the information. I will try. It is a pity that such a great feature not added into Urho3D’s main branch.

rku

I ported it back to Urho3D, you may check it out here: https://github.com/rokups/Urho3D/

yushli1

That is great! Thank you. I will check it out.